I recently wrote a sbt plugin that produces tabular test reports. My motivation
was to get better insights into the reliability of our test suite. Due to good
discipline most failures that occur are caused by flakiness of tests that
usually pass on developer machines, but are causing problems on the faster build machines.
We use GOCD as our build server. It doesn’t come with any
feature that helps analysing build failures over time. However with the
reports now being written as tabular text files, I was able to produce a list of
failures running the following command, which just concatenates all the
test results and finds failures:
find /go-server-home/artifacts/pipelines/my-pipeline -wholename  "*test-reports/test-results-*.txt" \
  | xargs cat \
  | grep -e 'FAILURE\|ERROR' \
  | awk '{print $1, $5"."$6}'  \
  | sort -r > failures.txt
I concatenated the last two fields, which are test suite name and test name to get a fully qualified name. I also wrote a little script that uses SSH, so that I can trigger this search from my local machine. Anonymising the test names the result looked something like this:
2015-04-24T12:25:46 A
2015-04-24T12:21:32 B
2015-04-24T10:42:35 C
2015-04-23T11:36:26 C
2015-04-23T11:36:26 D
2015-04-23T11:36:26 E
2015-04-22T12:38:54 B
2015-04-22T08:15:04 F
2015-04-22T08:15:04 G
…
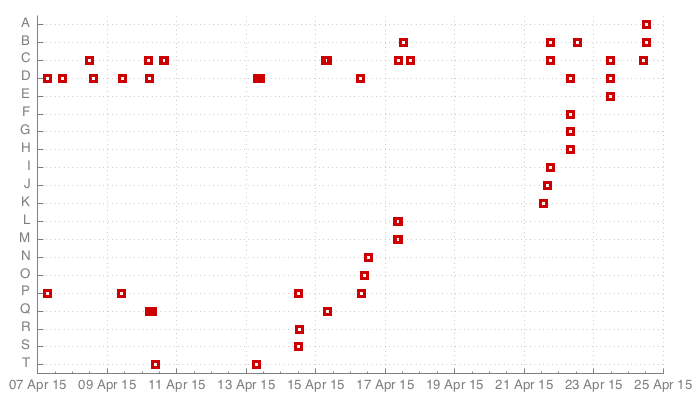
This already gave me a good idea what test cases to look for. To get an even better impression I created a
simple visualisation using the gnuplot-based time-line tool:
time-line \
    -o failures.png \
    --dimensions 700,400 \
    --font-size 10 \
    < failures.txt
The resulting graph looked like this:

It was interesting to see that the number of test that failed over three weeks of 20 was quite low in comparison to the total number of tests (more than 2000). Also, it’s easy to spot the flaky ones versus the genuine build breakages, e.g. B, C and D versus A.
When I looked at the failures in detail, I found numerous places where we synchronously asserted that asynchronous actions had taken place.
To me this experience confirmed that it is a good habit to try to get as much data as possible about a problem, before making generalisations. It also showed that it is not necessary to buy specialised tools, if data is made available in a format that can easily be consumed by the standard tools of the trade.
Leave a Reply